Power BI Business Intelligence & Analytics in Dubai
Whiz Solutions builds Power BI dashboards and reporting solutions that turn data scattered across your systems into a single, trusted view of the business. We give management real-time visibility into sales, inventory, operations, and performance, replacing slow, manual Excel reports with interactive dashboards and drill-down analytics. Our BI work is Microsoft Fabric-ready, built to scale from a single dashboard to an organization-wide reporting platform.
We design and build interactive Power BI dashboards tailored to how your management reads the business, with sales, operations, finance, inventory, and branch performance in one place. Dashboards are built for clarity and speed, so decisions come from live data rather than week-old spreadsheets.
Executive & KPI Dashboards
We create executive dashboards that surface the KPIs leadership actually acts on, with targets, trends, and exceptions at a glance. Drill-down paths let managers move from a headline number to the underlying detail without waiting on the reporting team.
Data Integration & Consolidation
We consolidate data from multiple systems, including ERP, accounting, operations, and custom applications, into a single reporting model. Disconnected sources become one coherent dataset, ending the manual copy-paste reconciliation that slows and distorts reporting.
Data Modeling (Power Query & DAX)
We build robust data models using Power Query for transformation and DAX for measures, so calculations are consistent, reusable, and correct. A clean model means dashboards that stay accurate and fast as data grows.
Reporting Automation
We automate refreshes and distribution so reports arrive current, on schedule, without anyone rebuilding them by hand. Scheduled refresh, alerts, and subscriptions replace the monthly scramble to assemble numbers.
Data Warehousing & Microsoft Fabric
We design data warehousing foundations and build Microsoft Fabric-ready analytics so your reporting scales with the organization. As data volume and sources grow, the platform grows with them rather than being rebuilt.
Self-Service Analytics Enablement
We structure datasets and train teams so business users can explore data and build their own views within a governed model. Analytics becomes a capability across the organization, not a bottleneck at one desk.
How We Work
Our approach
01
Define KPIs
We work with management to agree the metrics, dimensions, and questions the dashboards must answer.
02
Connect & model
We integrate the source systems and build a clean, validated data model with Power Query and DAX.
03
Design dashboards
We build interactive Power BI dashboards with drill-down, tested against real data and refined with your team.
04
Automate & support
We schedule refresh, set up distribution and alerts, and support the platform as your reporting needs evolve.
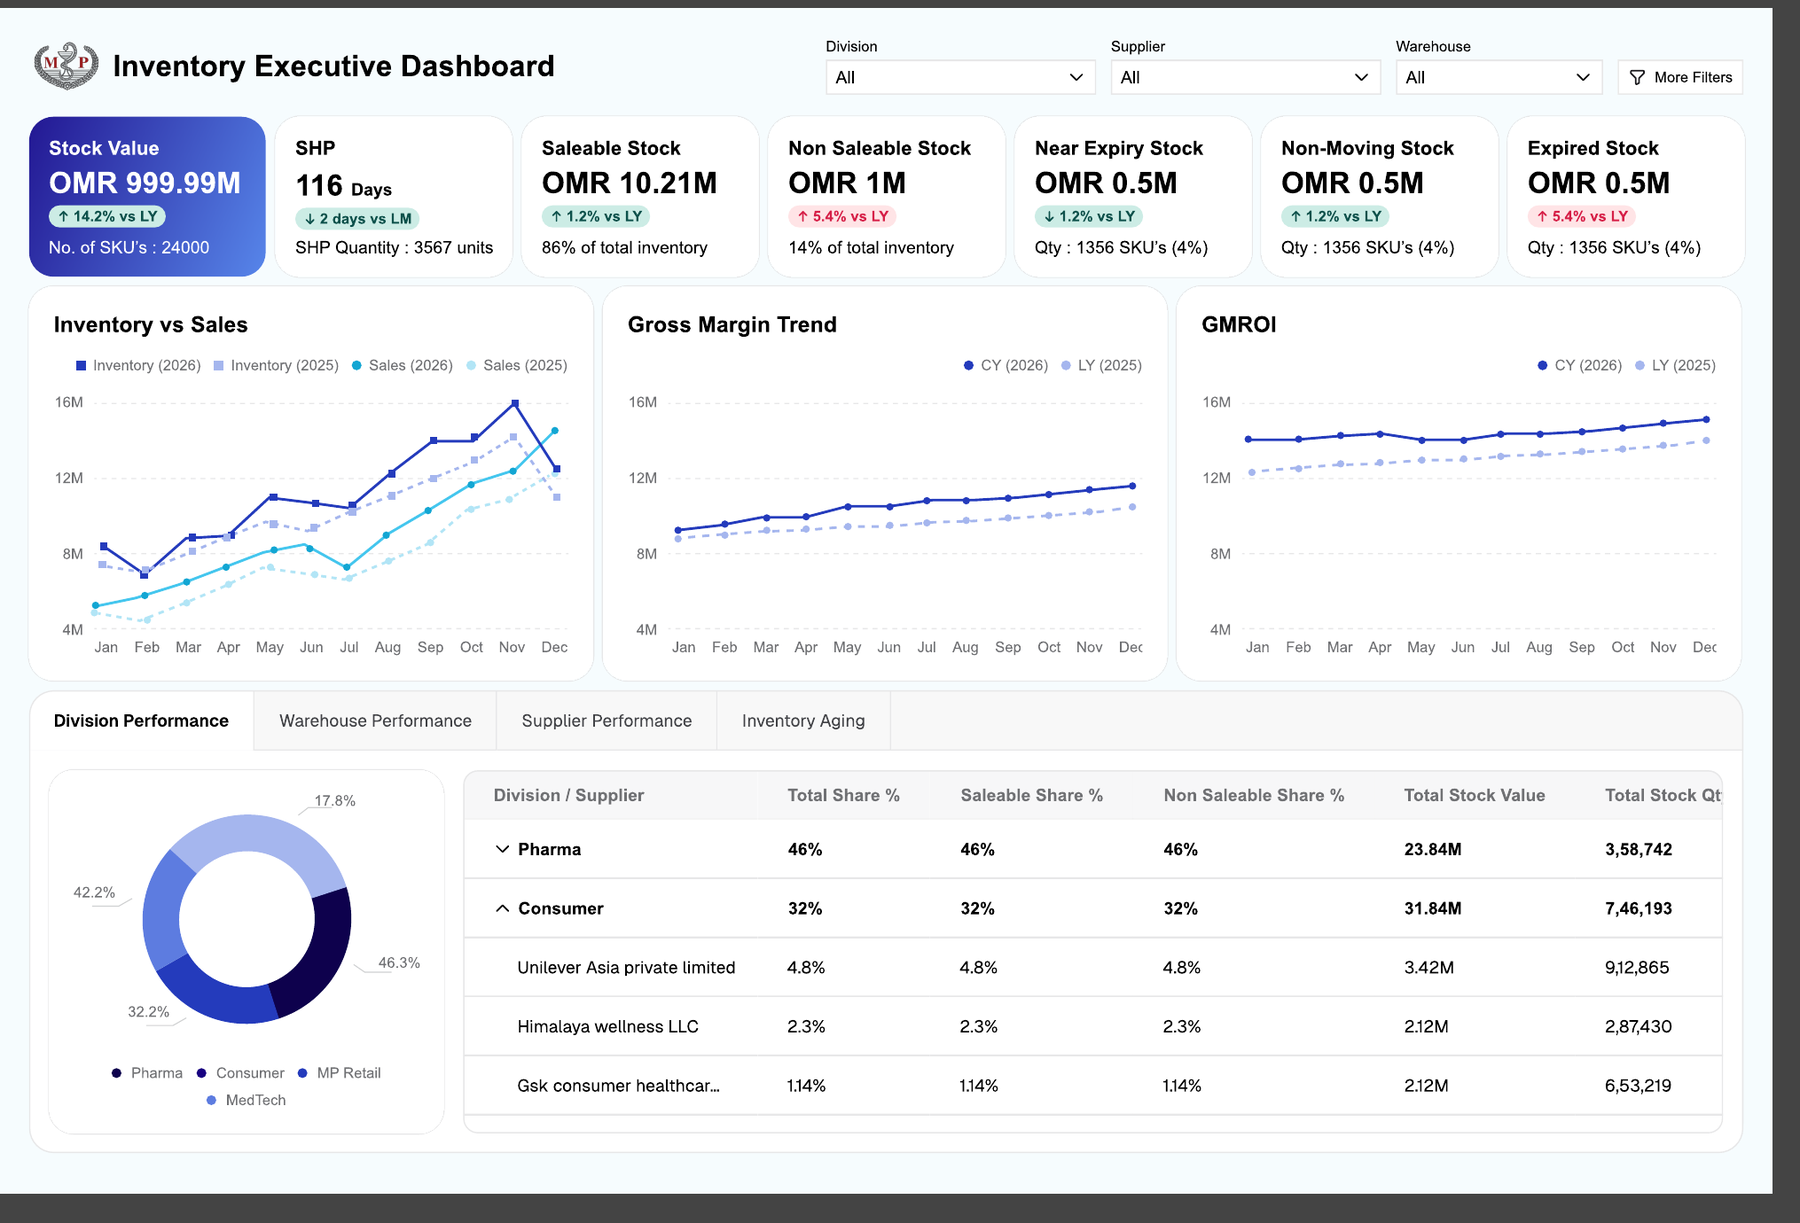
An inventory executive dashboard we built in Power BI, showing live stock, expiry, and division performance in one view.
Executive Power BI dashboards for a pharmacy retail chain.
We built interactive Power BI dashboards for a regional pharmacy retail group, consolidating sales, inventory, purchasing, and branch data from multiple systems into a single executive reporting platform. Management gained real-time KPI visibility and drill-down analytics across sales, product, inventory movement, supplier, and branch performance, replacing slow, manual Excel reports.
Power BI · SQL Server · Power Query · DAX
Construction productivity analytics.
We delivered live variance reporting for a leading Dubai construction group, feeding daily site data on labour, equipment, and completed quantities into Power BI dashboards that compare actual output against project estimates across every project.
ASP.NET Core · SQL Server · Power BI · REST API
Workforce utilization reporting.
We built dashboard analytics on top of a workforce time-management platform for the same construction group, giving management visibility into attendance, overtime, and labour productivity across multiple project sites.
ASP.NET Core · SQL Server · Power BI
FAQ
Frequently Asked Questions
How much does Power BI dashboard development cost in Dubai?
It depends on the number of data sources, the complexity of the model, and how many dashboards you need. A single executive dashboard over one clean source is very different from consolidating several systems into a governed model. We scope your case and provide a clear recommended scope, approach and proposal before starting.
Can you connect Power BI to our ERP and accounting system?
Yes. We integrate Power BI with ERP, accounting, operational, and custom systems, consolidating them into a single reporting model. Where direct connectors aren't available, we build the data pipeline to bring the data together reliably.
What's the difference between an Excel report and a Power BI dashboard?
Excel reports are static and rebuilt by hand each period; Power BI dashboards refresh automatically, let managers drill from summary to detail interactively, and pull consolidated data from multiple systems. The result is faster, more consistent reporting with far less manual effort.
Is Power BI ready for Microsoft Fabric?
Yes. Power BI is part of the Microsoft Fabric analytics platform, and we build data models and warehousing foundations that are Fabric-ready, so as your data and reporting needs grow, the platform scales without a rebuild.
How often do the dashboards update?
As often as the business needs, from scheduled daily or hourly refreshes to near real-time, depending on the data sources and licensing. We configure automated refresh and alerts so reports are always current without manual work.
Ready to replace manual Excel reporting with live Power BI dashboards? Book a free consultation with our Dubai team.
Since 2012 we've built and supported real systems for organizations across the Middle East and the United States. Let's scope yours.