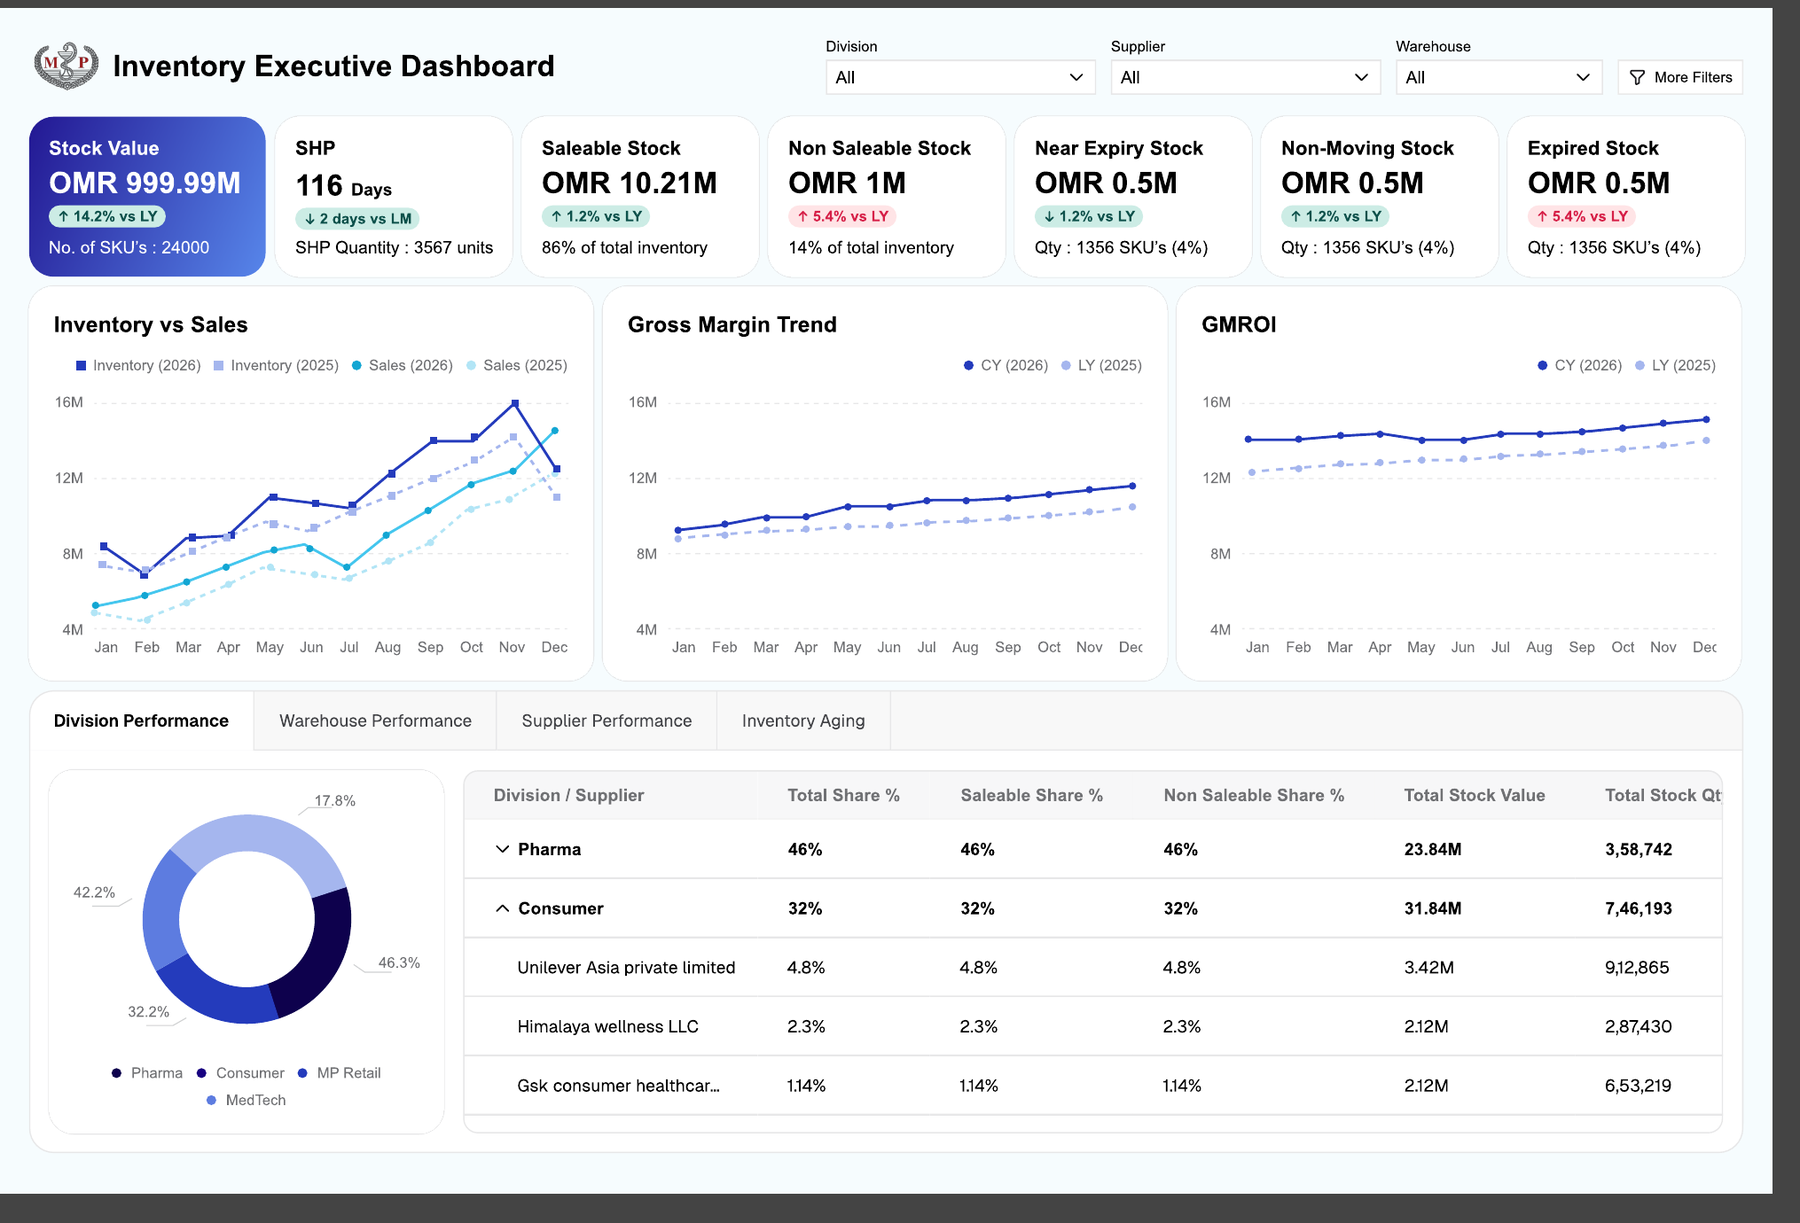
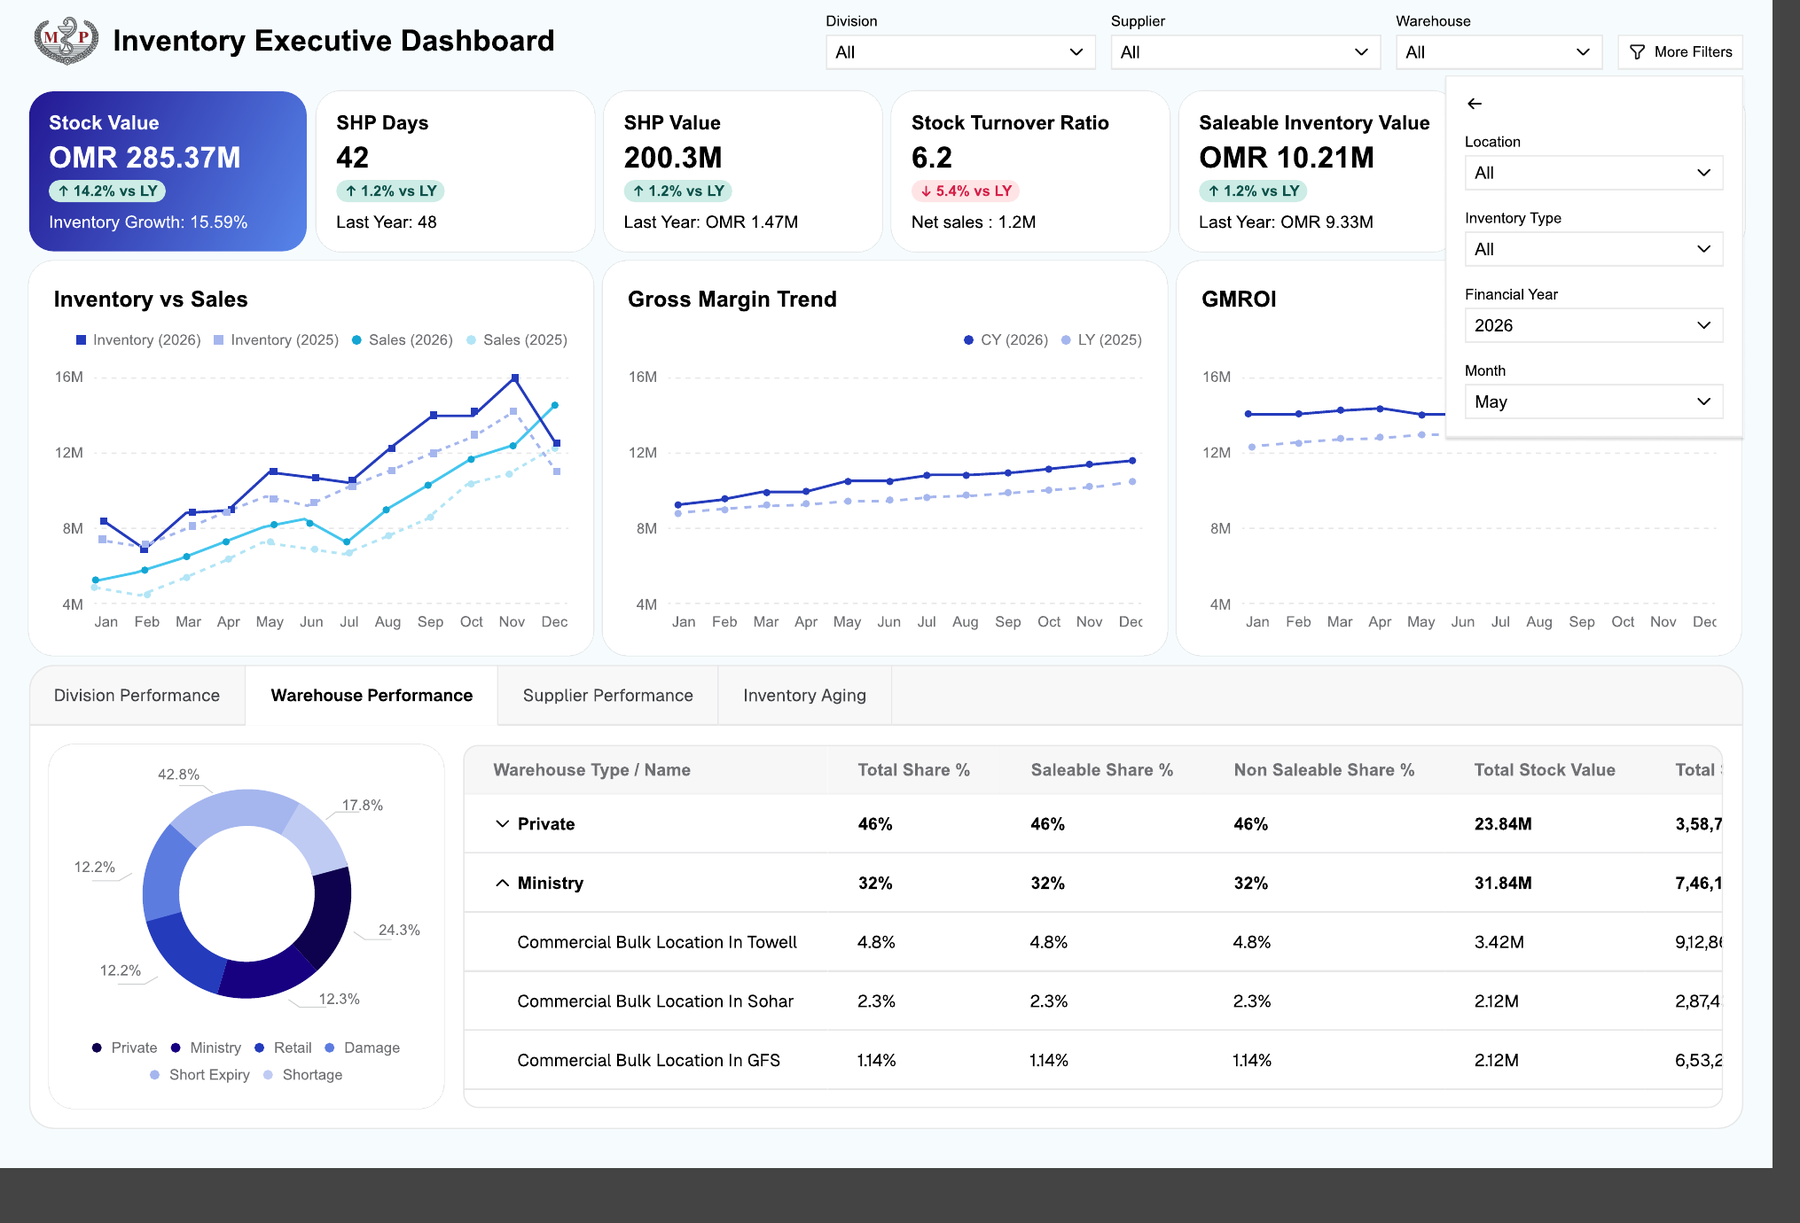
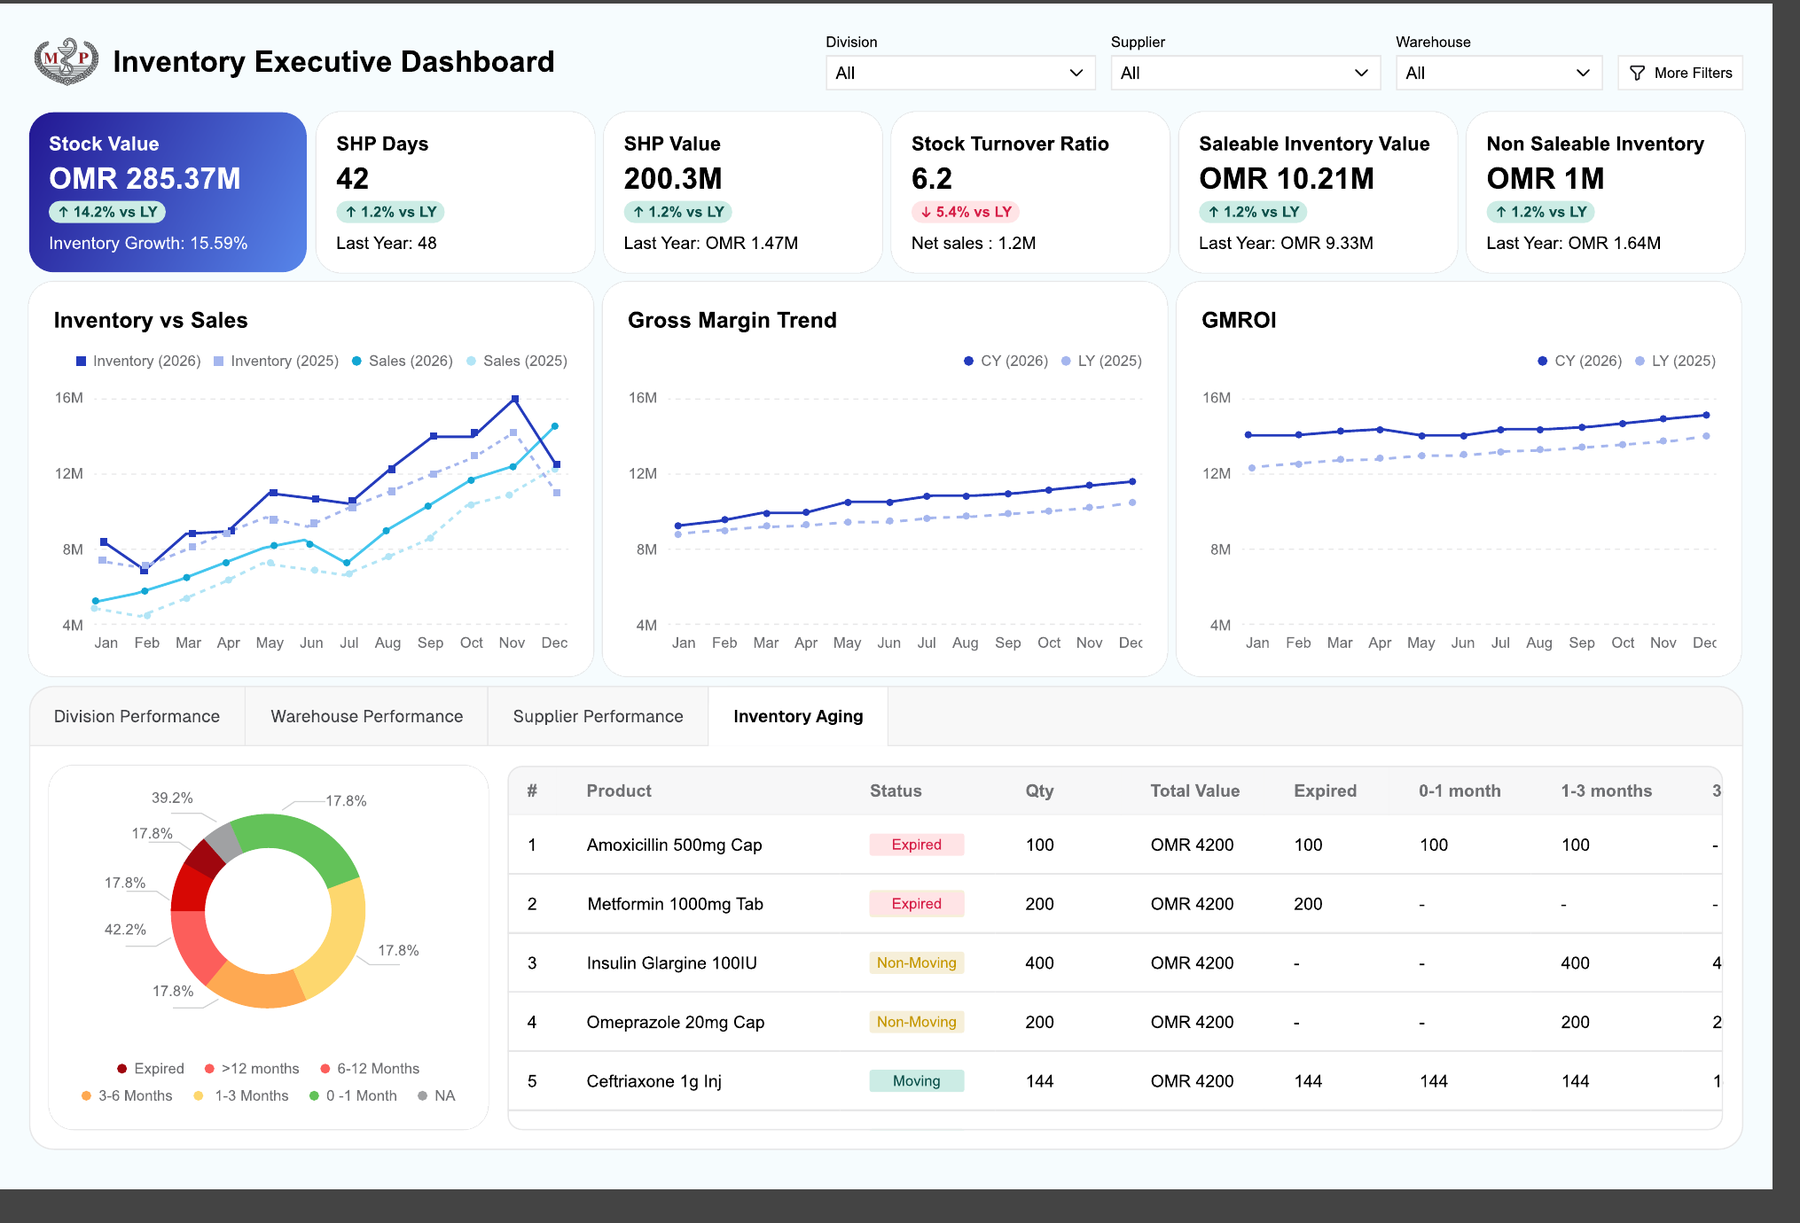
Built interactive Power BI dashboards for a regional pharmacy retail chain, consolidating sales, inventory, purchasing, and branch data from multiple systems into a single executive reporting platform. Management gained real-time KPI visibility and drill-down analytics covering sales performance, inventory movement, purchase trends, and branch and supplier performance, in place of slow, manual Excel reports.
✓Sales performance and product analysis dashboards
✓Inventory movement and purchase trend analytics
✓Customer, branch, and supplier performance views
✓Executive KPI dashboard with drill-down
✓Data consolidation from multiple systems
Inside the System
More Case Studies
Have a similar process running on spreadsheets?
Tell us how it works today, and our Dubai team will come back with a clear recommended scope, approach and proposal.